Have you ever stared at a pile of receipts at the end of the month, wondering what your average spending might be? How to find mean of your expenses might seem like a daunting math problem, but fear not! The mean, also known as the average, is a surprisingly simple concept that unlocks a world of understanding when it comes to analyzing data.
In this guide, we’ll break down how to find mean in a way that’s fun, clear, and applicable to your everyday life. We’ll delve into why the mean is important, conquer the steps to finding it, and explore some of its limitations. By the end, you’ll be a data whiz, ready to tackle any set of numbers with confidence.
What is the Mean?
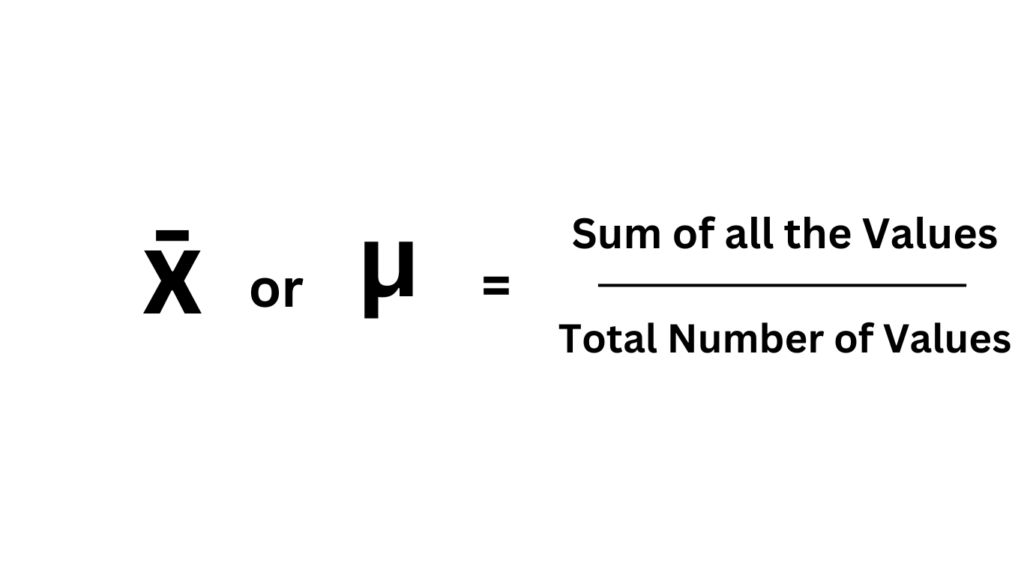
Let’s delve deeper into the concept of the mean and explore its significance in various contexts. The mean, often referred to as the arithmetic average, serves as a fundamental measure of central tendency in statistics. When we talk about finding the mean, we’re essentially finding the balance point or the “typical” value within a set of numbers. It’s like finding the sweet spot that represents the collective value of all the data points. Similarly, it is represented by ‘μ’ or ‘x̄’.
Why is the Mean Important?
The mean isn’t just about bragging rights about your high test scores (although a good average is definitely something to celebrate!). It’s a powerful tool that helps us understand data trends. Let’s say you’re tracking your daily water intake. By finding the mean of your water consumption for a week, you can see if you’re consistently hitting your hydration goals.
The mean also allows you to make comparisons between different datasets. Imagine you’re planning a camping trip with friends. You could find the mean temperatures for both of your desired locations to see which might be a more comfortable choice.
In everyday life, knowing how to find mean comes in handy for budgeting expenses, planning events, and even predicting outcomes. For example, when planning a family budget, you might calculate the mean monthly expenses to determine a realistic spending target. Or, when organizing a team event, you might use the mean to estimate the average attendance, ensuring adequate preparation.
The applications of the mean extend far beyond personal use. Businesses use the mean to track sales figures, scientists use it to analyze research results, and meteorologists use it to predict weather patterns. In short, the mean is a versatile tool that helps us make sense of the numerical world around us, but how to find mean actually?
Step-by-Step Guide on How to Find Mean
Now that you know why the mean is important, let’s dive into the exciting world of how to find mean. Don’t worry, it’s not rocket science. Here’s a simple breakdown:
Step 1: Identify Your Data Set
The first step is to gather your data. A data set is simply a collection of numerical values. It could be your test scores from the past semester, the number of steps you walk each day, or the price of groceries on your shopping list.
Here’s a tip: Make sure your data set only includes numbers. You can’t calculate the mean of things like your favorite colors or movie titles.
Step 2: Summation Time
Once you have your data set, it’s time to find the sum or say, addition. In simpler terms, the sum is the total of all your numbers added together. Let’s say your data set is {3, 7, 9, 5}. To find the sum, you would add these numbers together: 3 + 7 + 9 + 5 = 24.
Step 3: Divide and Conquer
Now comes the magic. We need to divide the sum we just calculated by the total number of values in our data set. This tells us the average value or the mean.
In our example, we had four numbers (3, 7, 9, 5) and a sum of 24. So, to find the mean, we divide the sum by the number of values: 24 / 4 = 6.
Step 4: Voila! The Mean is Revealed
Congratulations! You’ve just discovered how to find mean. In this example, the mean of your data set is 6. This tells you that, on average, the values in your data set fall around 6.
Therefore, to calculate the mean, you follow a simple procedure: add up all the values in the dataset and then divide the sum by the total number of values. This process ensures that each data point contributes proportionally to the overall average, making the mean a reliable indicator of the dataset’s central tendency.
Let’s practice:
How to find mean of the data set {10, 8, 7, 9}? Pause here and try it yourself before we move on.
(Need some space? Great job giving it a shot)
If you got 8.5, you’re absolutely right! See how easy it is to find the mean with a little practice?
Understanding the Mean’s Limitations
The mean is a fantastic tool, but it’s important to understand that it has limitations. Let’s explore some scenarios where the mean might not be the best way to represent your data.
1. Outliers and Skewed Data:
Imagine you’re tracking your monthly grocery bills. One month, you might have a large expense due to a birthday party. This high value, called an outlier, can significantly affect the mean. In this case, the mean might not accurately reflect your typical grocery spending.
Similarly, data can be skewed. Think about income levels in a city. A small number of people might earn very high salaries, while the majority earn more modest incomes. The mean income in this case could be misleadingly high, not reflecting the reality for most people.
2. Alternative Measures of Central Tendency:
When outliers or skewed data are present, other statistical measures can provide a more accurate picture of your data’s central tendency. Here are two options to consider:
- Median: The median is the “middle” number in your data set, once you’ve arranged the values from least to greatest. If you have an uneven number of values, the median is the average of the two middle numbers. The median is less susceptible to outliers than the mean.
- Mode: The mode is the most frequent number in your data set. For example, if you have the shoe sizes {7, 8, 8, 9, 7}, the mode is 8 because it appears the most often. The mode is useful when you’re interested in the most common value, but it doesn’t necessarily represent the “center” of your data.
When to Use Each Measure:
- Use the mean when your data is fairly symmetrical and free of extreme outliers.
- Use the median when your data is skewed or has outliers that might distort the mean.
- Use the mode when you’re interested in the most frequent value, rather than the average.
By understanding these different measures, you can choose the one that best represents your data and provides the most meaningful insights.
Common Mistakes and Pitfalls
Even the most enthusiastic data explorers can encounter roadblocks when dealing with how to find mean. Let’s explore some common mistakes that can occur when calculating the mean, and equip ourselves with strategies to avoid them.
Identifying and Addressing Errors in Mean Calculation
We’ve learned how to find mean, but even the simplest calculations can go awry. Here are some potential pitfalls to watch out for:
- Data Entry Errors: Typos happen! Double-check your data set to ensure all numbers are entered correctly. A single misplaced digit can significantly alter your mean.
- Mixing Data Types: Remember, the mean can only be calculated for numerical data. Don’t try to include non-numerical values like colors or names in your data set.
- Forgetting the Formula: Feeling a little rusty on the steps involved in finding the mean? No worries! The formula is simply the sum of your data set divided by the number of values (ΣX / n).
Here’s a tip: If you’re unsure about your calculations, try working through an example with a small data set first. This can help solidify your understanding of how to find mean and identify any potential errors.
Misinterpretation of Results
Once you’ve calculated the mean, it’s important to interpret the results correctly. Here are some things to keep in mind:
- Context is Key: The mean is just one piece of the puzzle. Consider the context of your data to understand what the mean truly represents. For example, the mean income in a city might be high, but it might not reflect the reality for most residents if the data is skewed by a few very high earners.
- Outliers Be Aware: Remember, outliers can significantly impact the mean. If your data set has outliers, consider using the median or mode for a more accurate representation of your data’s central tendency.
- Limitations of the Mean: The mean is a powerful tool, but it doesn’t tell the whole story. There might be other underlying patterns or trends within your data that the mean doesn’t capture. Explore other statistical measures to gain a more comprehensive understanding of your data.
Strategies for Avoiding Errors
By being mindful of these potential pitfalls, you can minimize errors when calculating the mean. Here are some helpful strategies:
- Double-Check Your Data: Before you start crunching numbers, take a moment to review your data set for any inconsistencies or typos.
- Choose the Right Measure: Not all data sets are created equal. Depending on the nature of your data, the mean, median, or mode might be the most appropriate measure of central tendency. Understanding the strengths and limitations of each measure will help you choose the right tool for the job.
- Practice Makes Perfect: The more you practice finding the mean with different data sets, the more comfortable and confident you’ll become. Challenge yourself with a variety of datasets to solidify your understanding.
By following these tips, you can avoid common mistakes and ensure your ‘how to find mean’ calculations are accurate and meaningful.
Conclusion
So, we’ve embarked on a journey to conquer confusion and discover how to find mean. Remember, the mean is simply the sum of your data set divided by the number of values. It’s a powerful tool that helps us understand data trends, make comparisons, and gain valuable insights from numerical information.
The mean may seem like a simple concept, but its applications are vast. From tracking personal goals to analyzing complex scientific data, the mean plays a crucial role in making sense of the world around us.
Now that you’re armed with the knowledge of how to find mean, put your newfound skills to the test. Gather some data sets from your daily life, whether it’s your sleep hours for a week or the number of push-ups you can do each day. Calculate the mean and see what insights you can glean from your data. The more you practice, the more comfortable you’ll become with this valuable statistical tool.
Frequently Asked Questions (FAQs)
1. How to find mean of the dataset?
The mean of the dataset can be calculated by adding all the values in the dataset and then dividing the sum by the total number of values.
2. Is the mean always the best way to represent my data?
The mean is a great starting point, but it can be skewed by outliers or unevenly distributed data. In these cases, consider using the median or mode for a more accurate representation of your data’s central tendency.
3. How can I find the mean of a large dataset?
For very large datasets, using a calculator or spreadsheet program can save you time and effort. Most programs have built-in functions for calculating the mean.
4. What are some other statistical measures I should learn about?
The mean is just one tool in the statistician’s toolbox As you delve deeper into data analysis, you’ll encounter other measures like variance, standard deviation, and correlation coefficients. These tools provide even richer insights into the relationships and patterns within your data.
2 Comments
Comments are closed.