Has Venn diagrams got you thinking? You must be wondering what are these unusual overlapping circles. What do they represent and why is it used in mathematics?
Hold on, because Venn diagrams aren’t just for math class. Imagine yourself juggling between two after-school activities, torn between drama club and robotics club. Or maybe you’re trying to plan a movie night that caters to everyone’s tastes in your family – action flicks for Dad, comedies for Mom, and something animated for the little ones.
Enter the Venn diagram, a versatile tool that can delightfully untangle these comparison conundrums. Think of it as a visual circus where different sets of things get their own spotlight, but the real magic happens when they overlap to reveal surprising connections. In the case of your after-school activities, a Venn diagram could show the creative aspects of both drama and robotics, highlighting a potential overlap if the robotics club involves building theatrical robots. So, to know more about its concept, stay tuned to the article.
What is a Venn Diagram?
Invented by mathematician John Venn in the 1880s, a Venn diagram uses overlapping circles to represent sets and their relationships. Each circle stands for a specific group of things, like the students who love art and the athletes who excel in sports. The areas where the circles overlap show the elements that belong to both sets. Think of it like a party – some guests might only love art (one circle), while others might only be into sports (the other circle). But the coolest part, the overlapping area, is where the true party animals reside – the students who enjoy both art and sports.
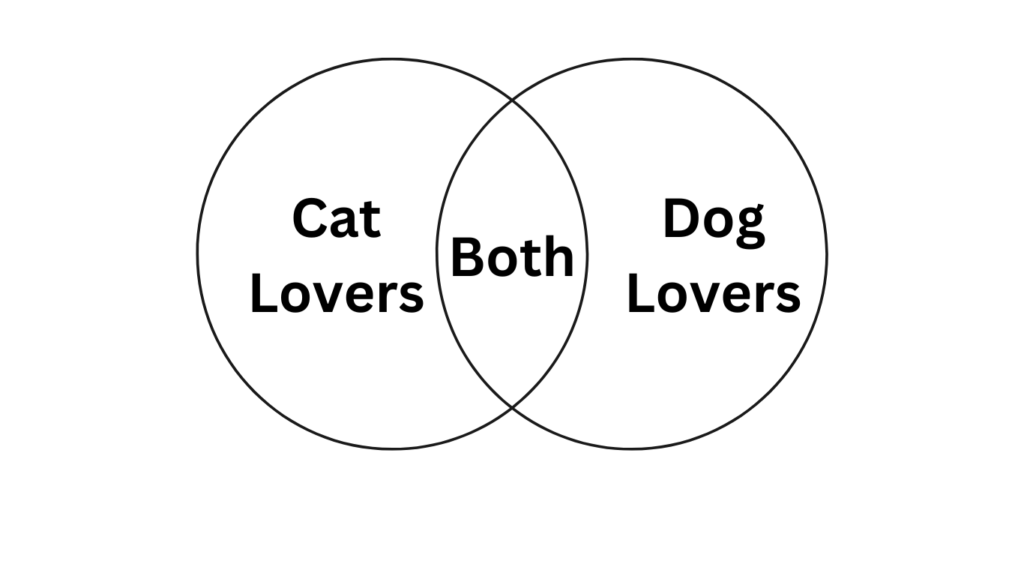
There are different types of Venn diagrams, but the most common ones deal with two or three sets. Imagine two circles – one labeled “Cat Lovers” and the other labeled “Dog Lovers.” In the space where the circles don’t overlap, you might find pictures of people who adore cats but aren’t too keen on dogs (and vice versa). But the magical center, the overlapping area, is where things get interesting. This is the prime spot for people who love both cats and dogs (we know they exist!).
How to Use a Venn Diagram
Ready to create your own Venn diagram masterpiece? Here’s a step-by-step guide that’s easier than juggling flaming batons (hopefully!):
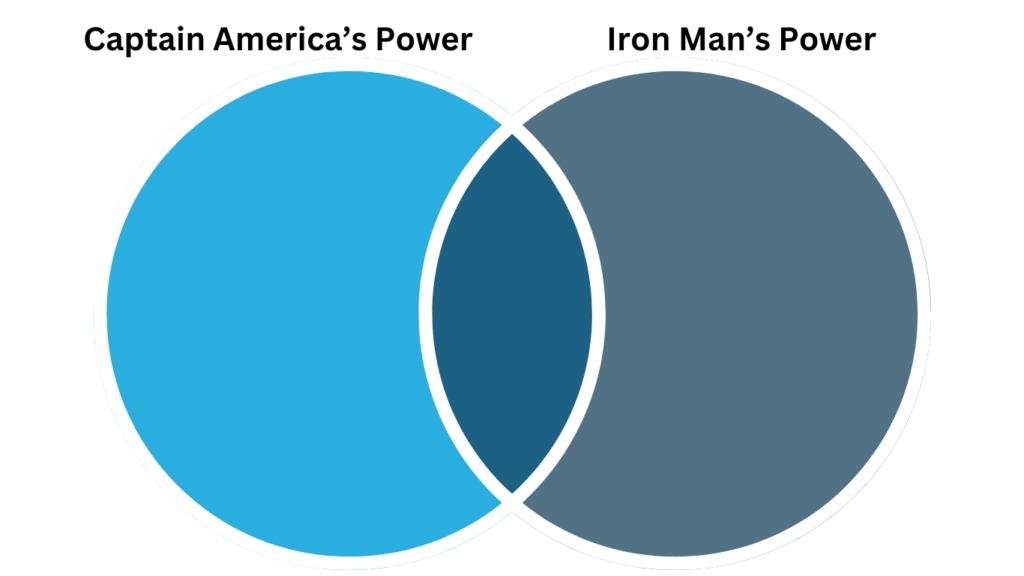
Step 1 Define Your Sets: The first step is to identify the two or three sets (groups of things) you want to compare. Let’s say you’re comparing the superpowers of your favorite superheroes – Captain America and Iron Man. Your sets could be “Captain America’s Powers” and “Iron Man’s Powers.”
Step 2 Label the Circles: Draw two circles that don’t quite touch. Label each circle with the name of your set (e.g., “Captain America’s Powers,” “Iron Man’s Powers”).
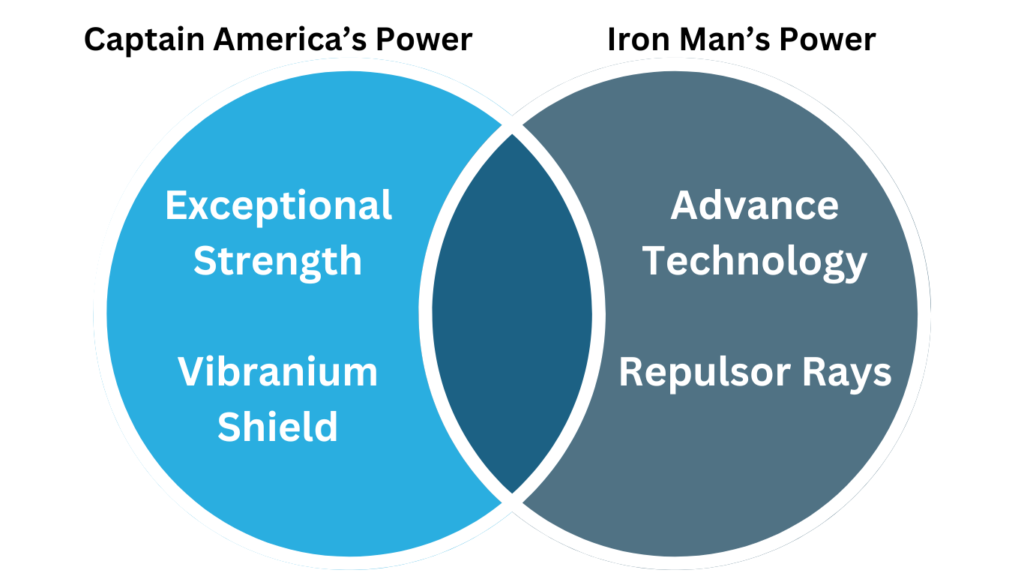
Step 3 Unique Elements: Think about the superpowers that are unique to each superhero. Write or draw these powers within their respective circles, outside the overlap area. Maybe Captain America has exceptional strength and a vibranium shield (unique to him), while Iron Man boasts advanced technology and repulsor rays (unique to him).
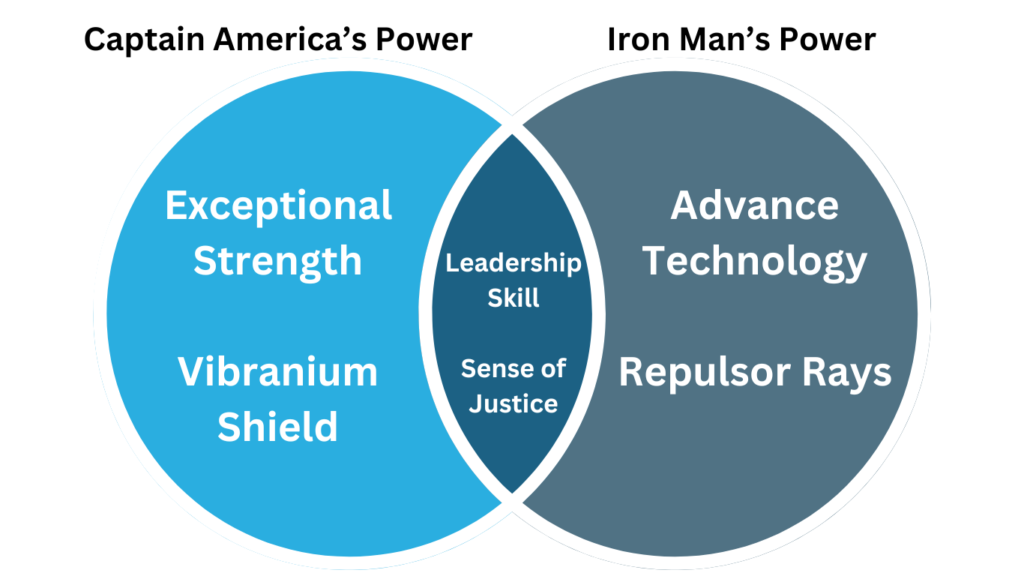
Step 4 Overlapping Awesomeness: Now for the exciting part! What superpowers do both Captain America and Iron Man share? Write or draw these shared powers in the area where the circles overlap. Perhaps they both possess incredible leadership skills and a strong sense of justice.
Benefits of a Venn Diagram
Venn diagrams are like superheroes for clear communication. Here’s why they’re so awesome:
- Visualization Power: They turn complex comparisons into a visually appealing picture, making it easier to understand relationships between sets. Imagine trying to explain the differences between superheroes in a paragraph – it would be a hassle.
- Organization Champs: They help you categorize elements based on their properties, keeping things neat and tidy. Just like sorting your superhero figurines based on their powers, they keep things organized.
- Critical Thinking Boost: By analyzing the overlaps and non-overlaps, you’re actively engaging your critical thinking skills, and identifying similarities and differences. Are there any surprising overlaps in superhero powers? It helps you find out.
- Communication Champions: They are a fantastic way to present information in a clear and concise way, perfect for explaining things to others. Imagine explaining superhero powers to your friends – it can make it a breeze.
Venn Diagrams in Action: Real-World Examples
Venn diagrams aren’t just for comparing superheroes; they’re superheroes in many fields. Here are some examples:
- Math Makes Sense: Teachers can use Venn diagrams to explain concepts like even and odd numbers, and prime and composite numbers. Imagine a Venn diagram with one circle for “even numbers” and another for “numbers divisible by 3.” The overlap area would show numbers that are both even and divisible by 3 (like 6 and 12).
- Literary Venn Diagram: Compare the personalities of two characters in a book. Are they both brave but one is more cunning? Imagine a Venn diagram comparing Harry Potter and Hermione Granger. One circle could be labeled “Harry’s Traits” and the other “Hermione’s Traits.” Within Harry’s circle, you might find words like “courageous,” “loyal,” and “athletic.” In Hermione’s circle, you might see “intelligent,” “resourceful,” and “bookish.” The exciting overlap area? This is where you’d find traits they both share, like “brave,” “determined,” and a strong sense of justice.
- Science Showdown: Use Venn diagrams to compare the properties of different states of matter (solid, liquid, gas). Imagine three circles labeled “Solid,” “Liquid,” and “Gas.” The “Solid” circle might have words like “definite shape” and “fixed volume.” The “Liquid” circle could have “indefinite shape” and “fixed volume.” The “Gas” circle might include “indefinite shape” and “indefinite volume.” The clever overlaps? The area between “Solid” and “Liquid” could show “can flow slightly” (think of toothpaste), while the overlap between “Liquid” and “Gas” might depict “easily compressible” (like fog).
- History Highlights: Compare the political structures of two different empires. Imagine a Venn diagram comparing the Roman Empire and the Han Dynasty. The “Roman Empire” circle might have words like “republic (later empire),” “senate,” and “expansionist.” The “Han Dynasty” circle could include “centralized government,” “civil service exams,” and “advanced technology.” The interesting overlap area? This is where you could highlight shared features like a strong emphasis on infrastructure and a well-defined legal system.
Limitations of a Venn Diagram
While Venn diagrams are fantastic tools, it’s important to know their limitations:
- Limited Circle Club: They work best for comparing a small number of sets (typically 2-4). Imagine trying to juggle five flaming batons – it gets tricky. Similarly, a Venn diagram with too many sets can become visually complex and confusing.
- Not for Complex Relationships: For highly intricate relationships between sets, other visual tools like Euler diagrams might be a better fit. Imagine trying to compare the personalities of five superheroes in a single Venn diagram – it might be overwhelming. Euler diagrams use overlapping shapes (not just circles) to represent more complex relationships.
Common Mistakes and Pitfalls
Just like any superhero might stumble, there are a few common mistakes to avoid when creating or interpreting Venn diagrams:
- Unclear Set Definitions: Ensure your sets are clearly defined and don’t overlap too much in their unique elements. Imagine a Venn diagram comparing “healthy foods” and “delicious foods.” If both circles have too many overlaps (like fruits and vegetables), it might be unclear what makes each set unique.
- Misplaced Elements: Make sure elements are placed correctly within the circles based on whether they belong to one set, both sets, or neither. Imagine putting Captain America’s shield (unique to him) in the overlap area with Iron Man’s powers – that wouldn’t be accurate!
- Overstuffed Circles: Don’t try to cram too many elements into your Venn diagram. It can become visually overwhelming and defeat the purpose of clear communication. Imagine a Venn diagram comparing hobbies with twenty different activities – it might be hard to decipher.
Conclusion
Finally, by understanding Venn diagrams and their applications, you’ve unlocked a powerful tool for clear thinking, effective communication, and making those comparisons a breeze. So, the next time you need to compare things, grab a pen and get ready to draw some circles – the Venn diagram circus awaits. Unleash your creativity, explore different sets, and have fun making comparisons in a clear and visually engaging way. Remember, the possibilities are endless – from planning the perfect movie night to understanding complex scientific concepts, Venn diagrams are there to help you navigate the world of comparisons with confidence.
Frequently Asked Questions (FAQs)
How do I create a Venn diagram?
To create a Venn diagram, start by identifying the sets you want to compare or analyze. Then, draw circles or shapes representing each set, ensuring they overlap where appropriate to illustrate relationships. Finally, label each region to indicate the elements it represents.
What are some common mistakes to avoid when using Venn diagrams?
Some common mistakes to avoid include misinterpreting circle sizes, neglecting to consider empty sets or overlapping regions, and failing to accurately label elements within each region. It’s essential to double-check your diagram for accuracy and clarity before drawing conclusions.
How can I use Venn diagrams in my field or area of study?
Venn diagrams can be applied in virtually any field or area of study to visualize relationships, categorize data, and solve problems. Whether you’re a mathematician, biologist, business analyst, or computer scientist, Venn diagrams offer a versatile and powerful tool for organizing information and gaining insights.